Clarity and transparency in customer flow analysis
In order to obtain a clear understanding of customer experience and behaviour within a store, it is necessary to visualize the observation results in a meaningful way.
ShopperResearch provides a comprehensive range of display options allowing users to share in the experience of events at the point of sale (if required, the client obtains an analysis tool for independent use).
From heat maps of the “store circulation” via displays of the flow patterns and intensive product information at shelving section level to the animated simulation of processes, users are supplied with an informative and clear picture of customer behaviour.
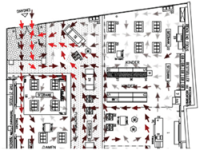
Direction of flow

A knowledge of flow trends means that products can be positioned sensibly within the store to match the sequence of purchasing.
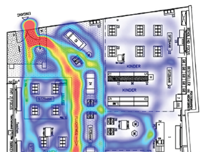
Heat map progress

The main traffic flow, the overall "circulation" and "dead areas" quickly become visible in the heat map display.
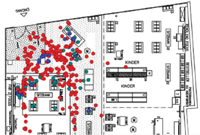
ustomer flow simulations

The combined reproduction of individual observations enables users to "experience" the basic pattern of customer behaviour inside the sales area in a clear way.
Further evaluation is possible with automated statistical analyses available at the touch of a button. The key performance indices, such as conversion rates, or the braking effect of certain products or advertising media can be compared for the various departments or shelf displays, thus providing a swift and pragmatic way of revealing where action is needed and approaches to best practice can be employed.
There is also an option of carrying out classifications of customer groups or time sequence analyses.
At a glance
